Cloud Finops - Cost Management
Cloud FinOps centralizes financial operations for cloud environments, helpingenabling teams to monitor spending, analyze usage patterns, and optimize costs,cloud costs efficiently. The platform provides unified visibility into AWS cloud spending, helping organizations track usage,financial performance, detect anomalies, and allocateidentify resourcespotential efficientlycost-saving opportunities.
The FinOps module acrossincludes the following sections:
-
Overview
-
AWS Cost Analyzer
-
Saving Opportunities
-
AWS Cost Map
These features help finance and engineering teams gain deeper insights into cloud spending and improve cost optimization strategies.
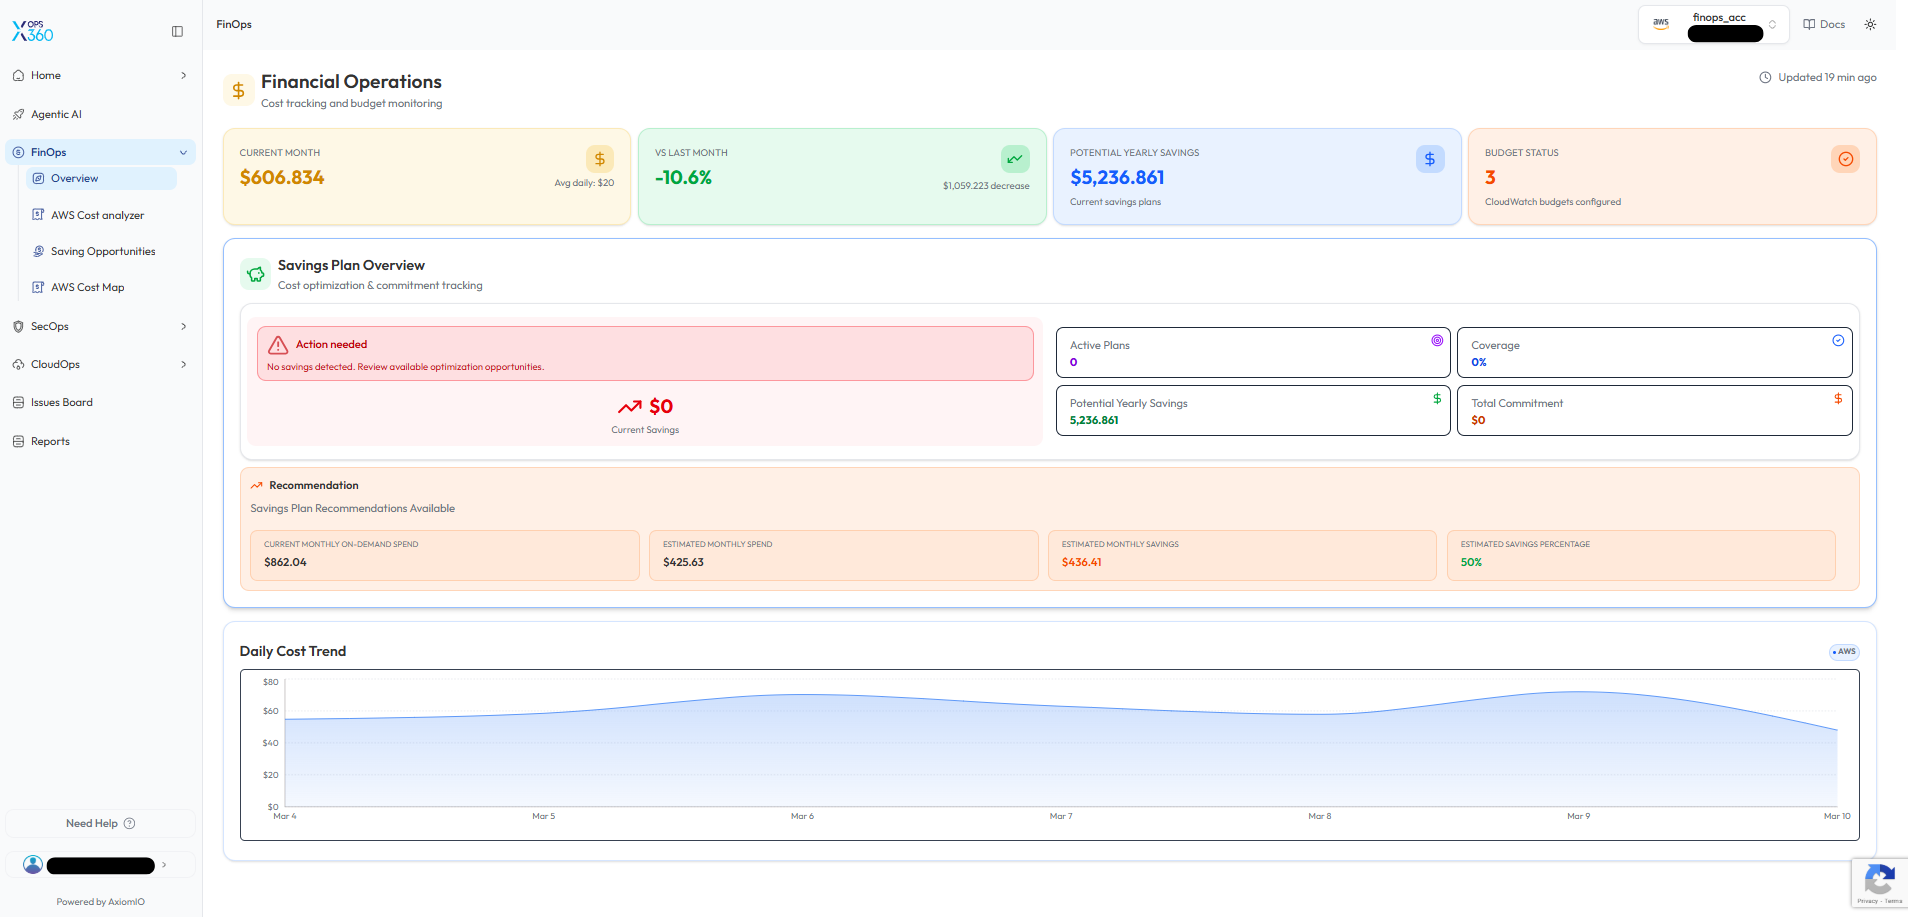
FinOps Overview
The FinOps Overview dashboard provides a summary of cloud financial operations and cost monitoring.
-
Current Month Spend – Displays the total AWS
andspendingAzure.forUnlikethestandalonecurrent billing period. -
Spend vs Last Month – Shows cost
tools,changesourcomparedsolutiontointegratesthe previous month. -
Potential Yearly Savings – Estimates cost reductions achievable through savings plans.
-
Budget Status – Displays configured budget monitoring alerts.
The dashboard also includes a multi-cloudSavings insights,Plan detailedOverview breakdowns,section that tracks:
-
Active savings plans
-
Savings plan coverage
-
Total commitment
-
Estimated yearly savings
Additionally, the Daily Cost Trend chart helps visualize spending patterns and identify cost fluctuations over time.
🔹 Why it’s useful:
This overview provides a centralized snapshot of financial operations, allowing teams to quickly evaluate cloud cost performance and potential optimization recommendationsopportunities.
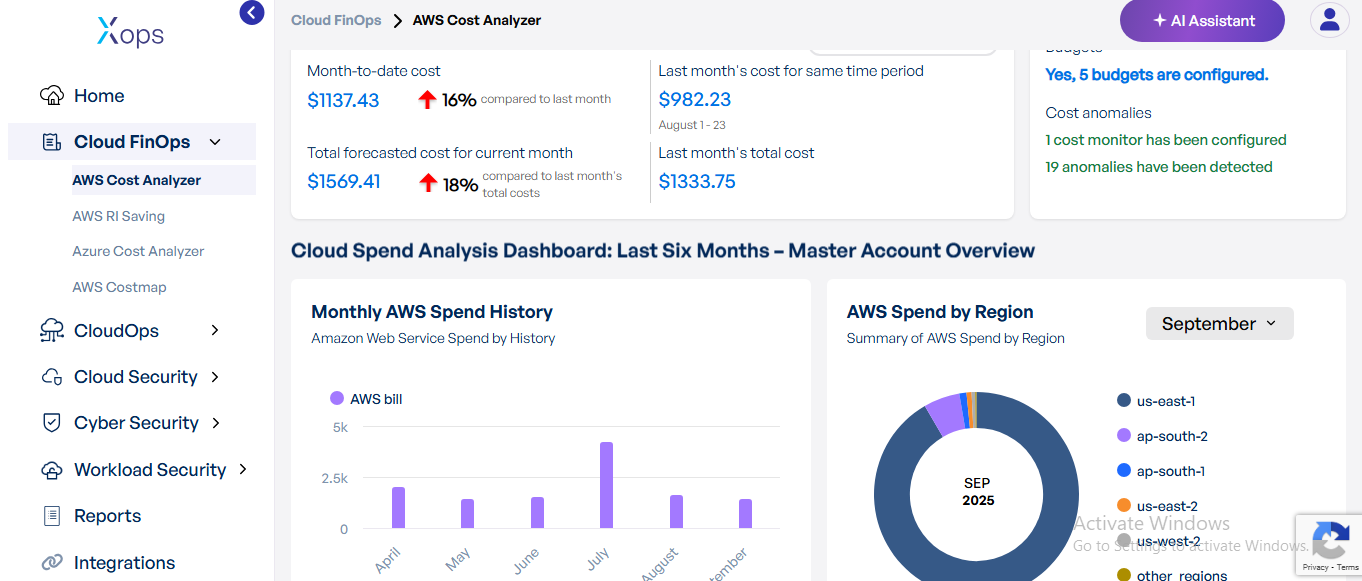
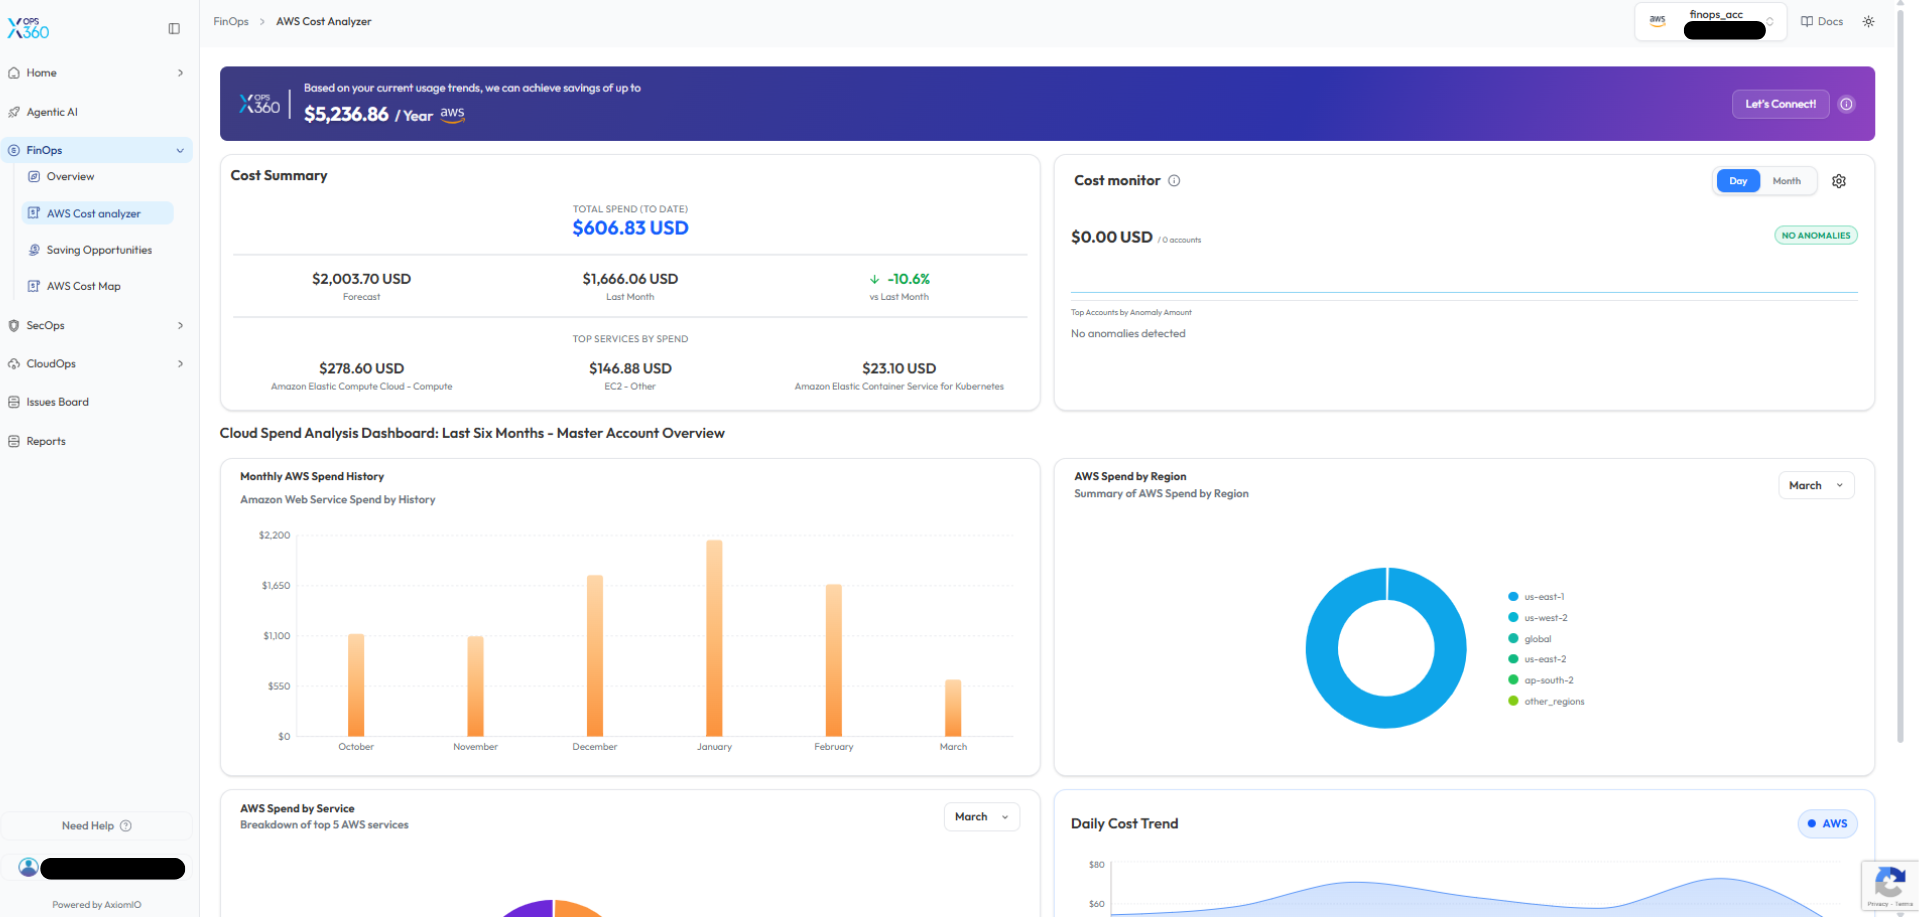
AWS Cost Analyzer
The AWS Cost Analyzer provides detailed visibility into AWS spending and cost distribution.
Key capabilities include:
-
ProvidesCostdeep cost visibilitySummaryacross–AWSDisplaysservicestotallikespendEC2,toS3,date,EKS,forecastedVPC,costs, andmore.comparisons with previous months. -
TracksCostdaily,Monitormonthly,–andDetectsservice-levelanomalies or unusual spendingtrendsto identify cost drivers.patterns. -
DetectsMonthlyunexpectedAWSspikesSpendor anomaliesHistoryfor–proactiveShows historical costmanagement.trends across multiple months. -
SupportsAWSgranularSpendfiltersby Region(by–service,Visualizestime,spendingordistributionaccount) for accurate insights.
🔹 Why it’s better:Most tools show only high-levelacross AWS billing data. This analyzer goes further with fine-grained service insights and daily tracking, enabling faster anomaly detection and better cost accountability.
AWS RI Saving
Identifies workloads suited forReserved Instances (RIs)to reduce costs.regions.-
theEstimatesAWSpotentialSpendsavingsby Servicevs.–on-demandHighlightspricing.services - contributing
Recommendsthecommitmentmostplanstobasedoverallon past usage trends. Helps finance and engineering teamsalign budgets with real workload patterns.costs.
🔹 Why it’s better:
Unlike standardbasic AWSbilling tools,dashboards, this featureanalyzer provides actionablemulti-dimensional recommendationsinsights withinto aspending clearpatterns, savingsmaking estimate.it Iteasier reducesto guessworkidentify cost drivers and ensuresdetect youanomalies don’t overcommit or underutilize RIs.early.
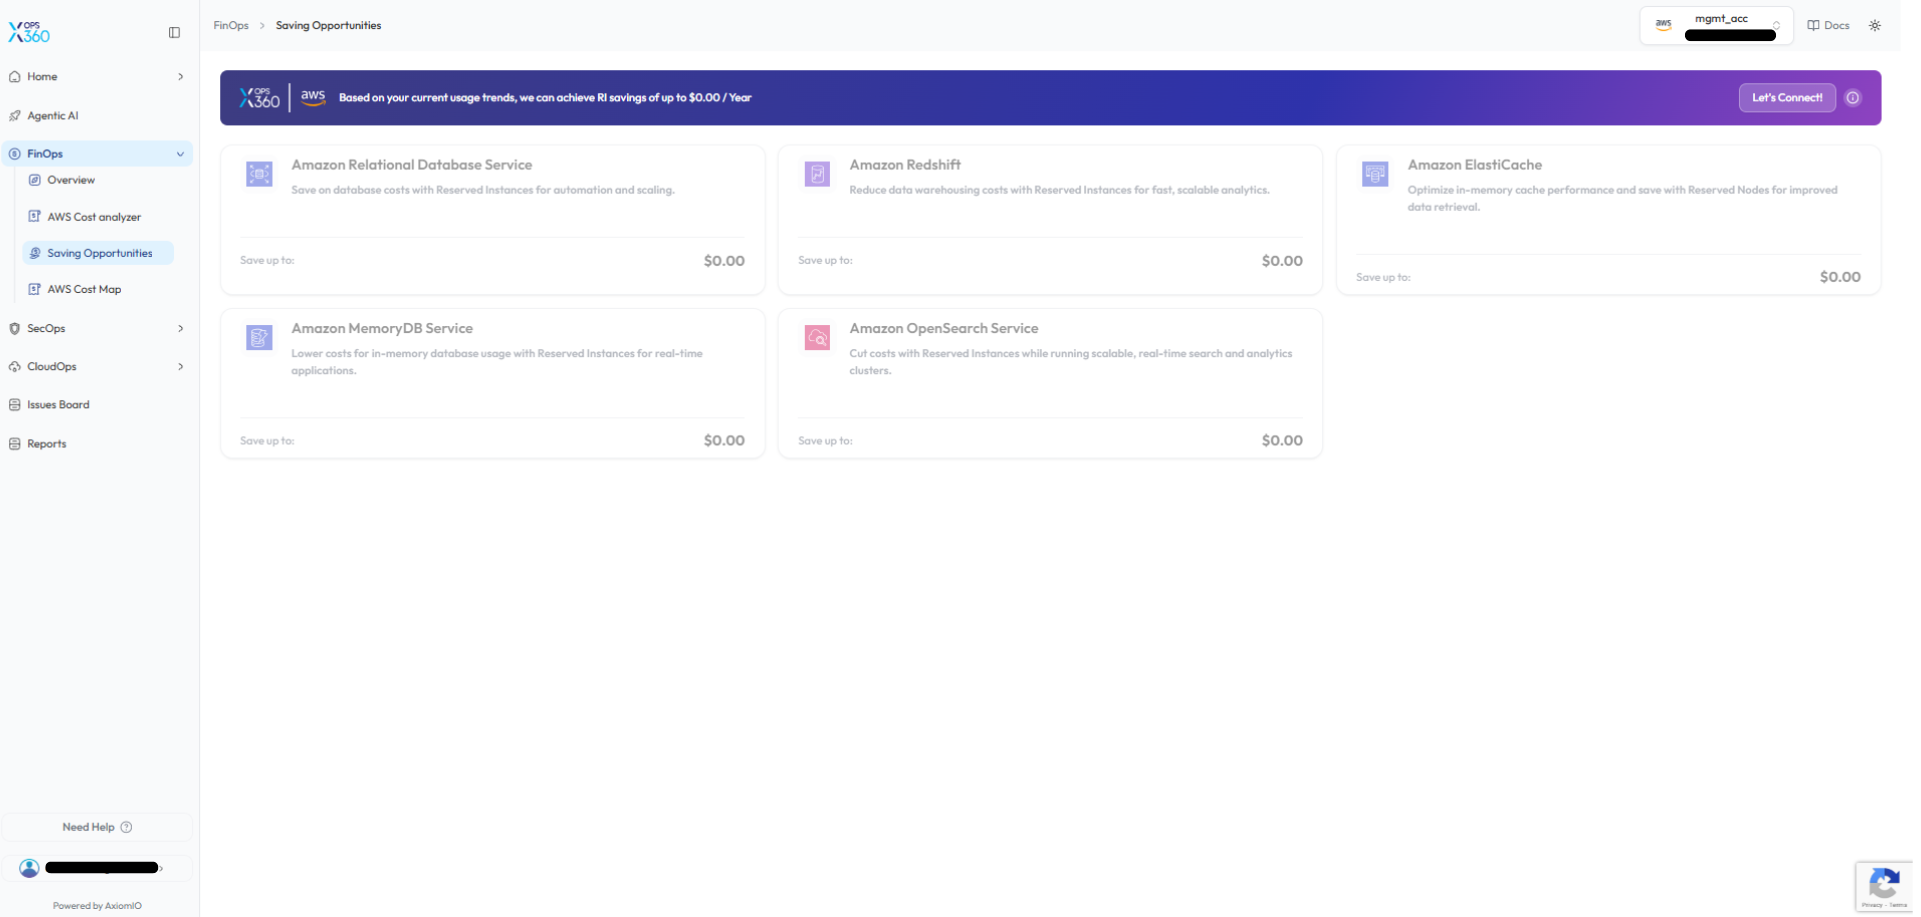
AzureSaving Cost AnalyzerOpportunities
- Saving Opportunities section identifies AWS services that could benefit from cost optimization strategies.
andProvidesTheend-to-endplatformvisibilityevaluatesofusageAzurepatternsspending.suggests - opportunities
Keyforbreakdownsservicesinclude:such as:-
MonthlyAmazonSpendRelationalHistoryDatabase Service (RDS)→ visualize cost trends. -
SpendAmazonby LocationRedshift→ regional usage insights (e.g., Global vs US East). -
SpendAmazonby ServiceElastiCache→ highlights top cost drivers like Virtual Network, SaaS, Databases, and Security. -
SpendAmazonbyMemoryDBSubscription -
Amazon OpenSearch Service
→ compare dev, test, and production costs.
-
- insights
Helpshelppinpointteams determine wherehigh-costReservedAzureInstancesservicesor savings plansforcanoptimization.reduce costs.
The
These
🔹 Why it’s better:UnlikeInstead Azure’sof defaultmanually Costanalyzing Management,cloud usage, this toolfeature providesautomatically aidentifies simpler,workloads unifiedthat dashboardcould withbenefit cross-comparisonfrom acrossoptimized subscriptionspricing andmodels, services,helping makingorganizations itreduce easiercloud forexpenses teams to spot inefficiencies quickly.efficiently.
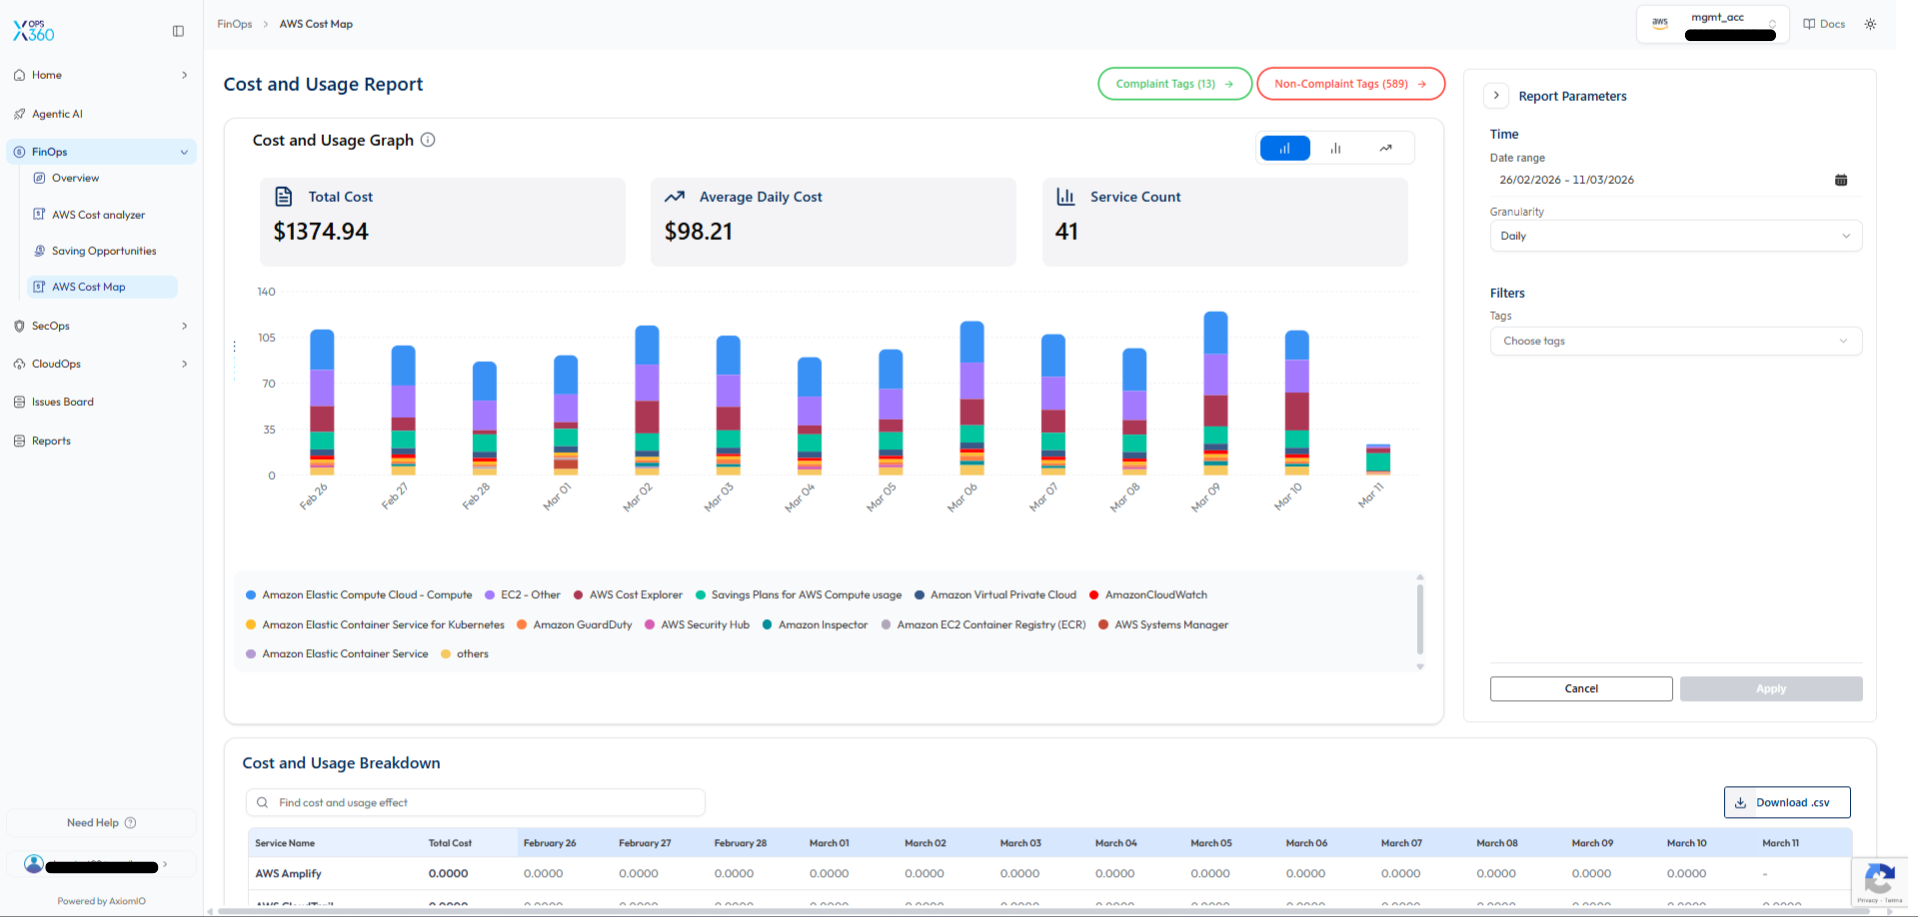
AWS Cost Map
The AWS CostmapCost Map provides a detailed visualization of AWS cost and usage trends.
Key features include:
-
VisualizesTotaldaily AWS costs and usage trendsCostin–anDisplayseasy-to-readtheformat.overall cloud spending within the selected time range. -
BreaksAveragedown spend per service (e.g., EC2, EKS, VPC,Daily CostExplorer).– Shows average daily spending trends. -
ProvidesService Count – Displays the number of AWS services contributing to costs.
Additional capabilities include:
-
time-basedCost and Usage Graph – Visualizes daily costtrackingdistributionforbyquickAWSanomaly detection.service. -
Cost and Usage Breakdown Table – Displays detailed cost data per service.
-
Filtering Options – Allows filtering by date range, granularity, and resource tags.
-
CSV
exportExport – Enables downloading cost data foradvancedexternal analysis and reporting.
🔹 Why it’s better:MostUnlike toolstraditional billing dashboards that show only giveaggregated monthly aggregates.costs, Costmapthe showsCost Map provides granular daily patternsinsights, sohelping youteams candetect catchcost spikes early, preventingand maintain better cost overrunscontrol.
billing cycles end.