Cloud Finops - Cost Management
Cloud FinOps centralizes financial operations for cloud environments, enabling teams to monitor spending, analyze usage patterns, and optimize cloud costs efficiently. The platform provides unified visibility into AWS cloud spending, helping organizations track financial performance, detect anomalies, and identify potential cost-saving opportunities.
The FinOps module includes the following sections:
-
Overview
-
AWS Cost Analyzer
-
Saving Opportunities
-
AWS Cost Map
These features help finance and engineering teams gain deeper insights into cloud spending and improve cost optimization strategies.
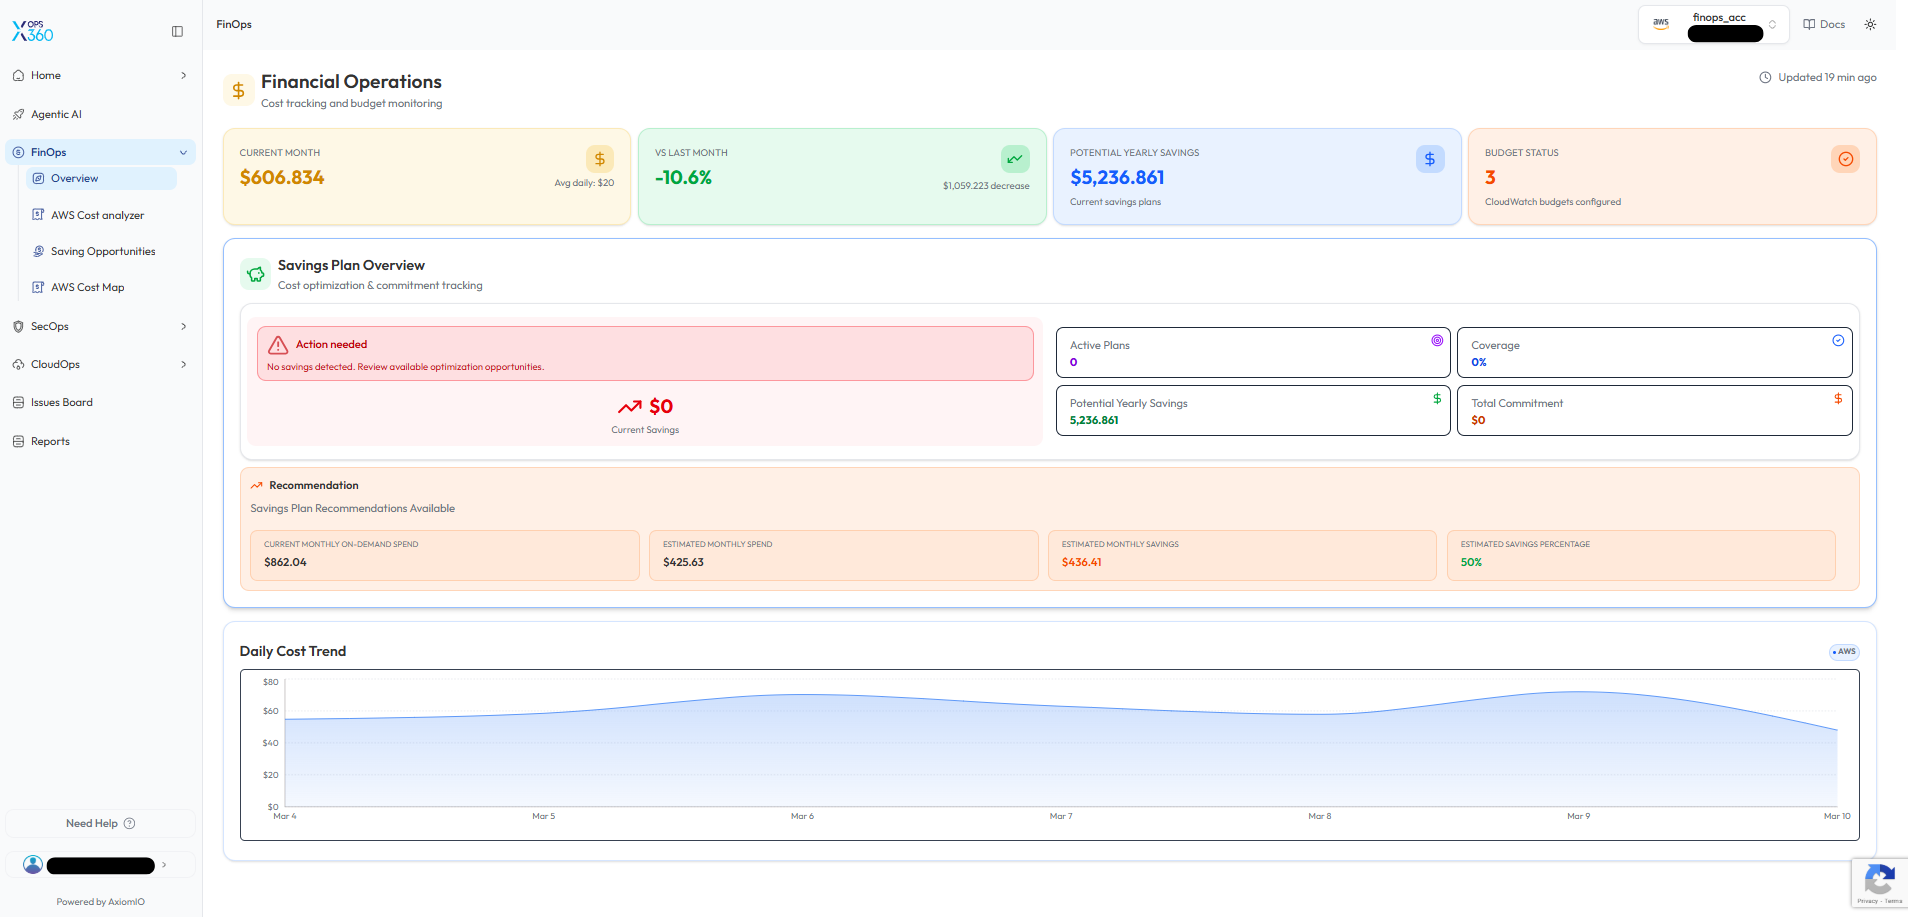
FinOps Overview
The FinOps Overview dashboard provides a summary of cloud financial operations and cost monitoring.
-
Current Month Spend – Displays the total AWS spending for the current billing period.
-
Spend vs Last Month – Shows cost changes compared to the previous month.
-
Potential Yearly Savings – Estimates cost reductions achievable through savings plans.
-
Budget Status – Displays configured budget monitoring alerts.
The dashboard also includes a Savings Plan Overview section that tracks:
-
Active savings plans
-
Savings plan coverage
-
Total commitment
-
Estimated yearly savings
Additionally, the Daily Cost Trend chart helps visualize spending patterns and identify cost fluctuations over time.
🔹 Why it’s useful:
This overview provides a centralized snapshot of financial operations, allowing teams to quickly evaluate cloud cost performance and potential optimization opportunities.
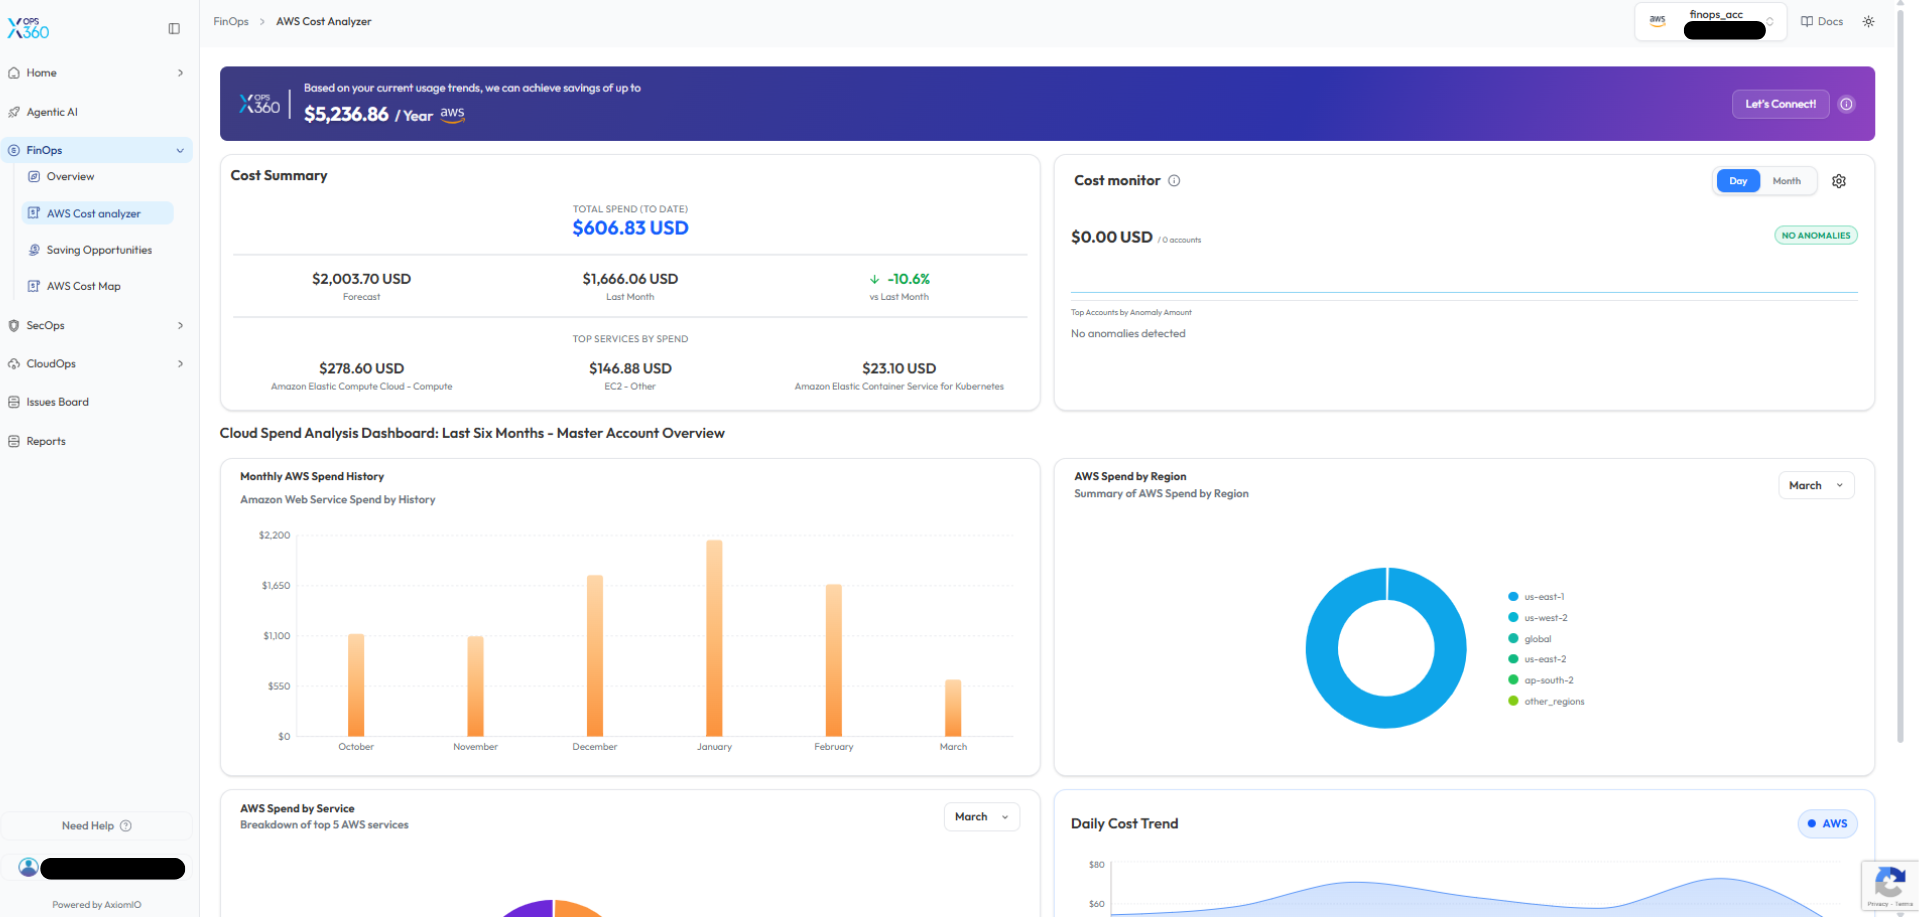
AWS Cost Analyzer
The AWS Cost Analyzer provides detailed visibility into AWS spending and cost distribution.
Key capabilities include:
-
Cost Summary – Displays total spend to date, forecasted costs, and comparisons with previous months.
-
Cost Monitor – Detects anomalies or unusual spending patterns.
-
Monthly AWS Spend History – Shows historical cost trends across multiple months.
-
AWS Spend by Region – Visualizes spending distribution across AWS regions.
-
AWS Spend by Service – Highlights the services contributing the most to overall costs.
🔹 Why it’s better:
Unlike basic billing dashboards, this analyzer provides multi-dimensional insights into spending patterns, making it easier to identify cost drivers and detect anomalies early.
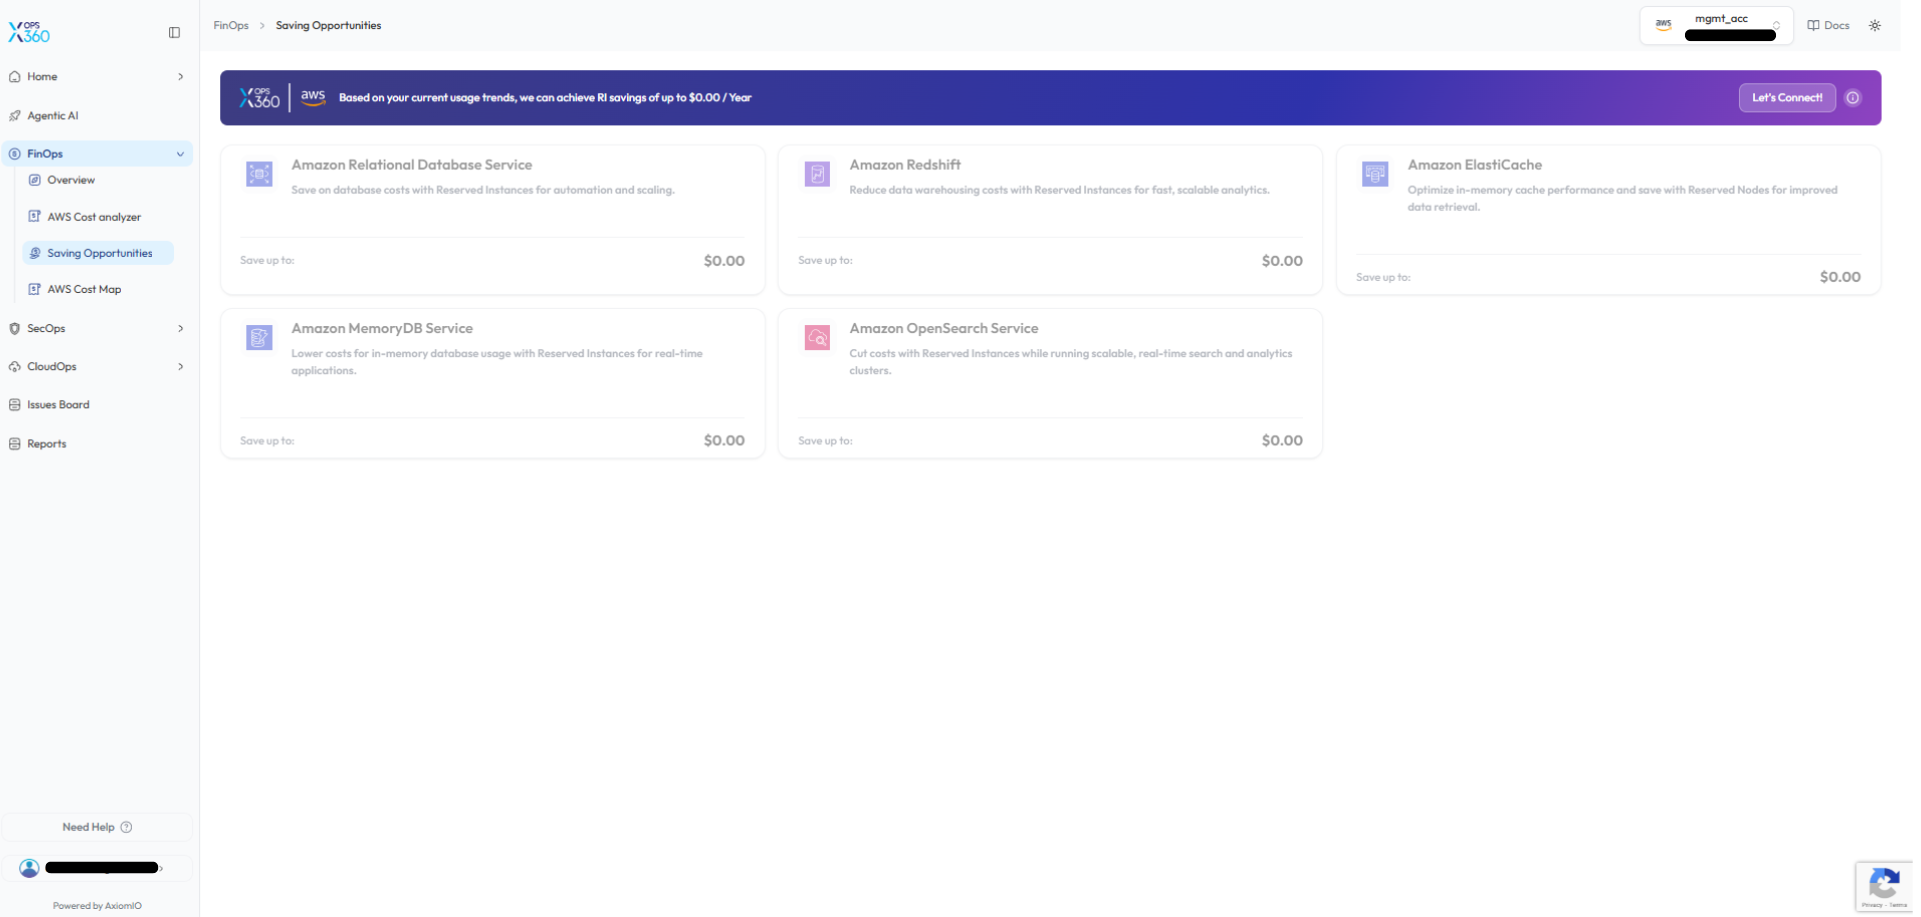
Saving Opportunities
The Saving Opportunities section identifies AWS services that could benefit from cost optimization strategies.
The platform evaluates usage patterns and suggests opportunities for services such as:
-
Amazon Relational Database Service (RDS)
-
Amazon Redshift
-
Amazon ElastiCache
-
Amazon MemoryDB
-
Amazon OpenSearch Service
These insights help teams determine where Reserved Instances or savings plans can reduce costs.
🔹 Why it’s better:
Instead of manually analyzing cloud usage, this feature automatically identifies workloads that could benefit from optimized pricing models, helping organizations reduce cloud expenses efficiently.
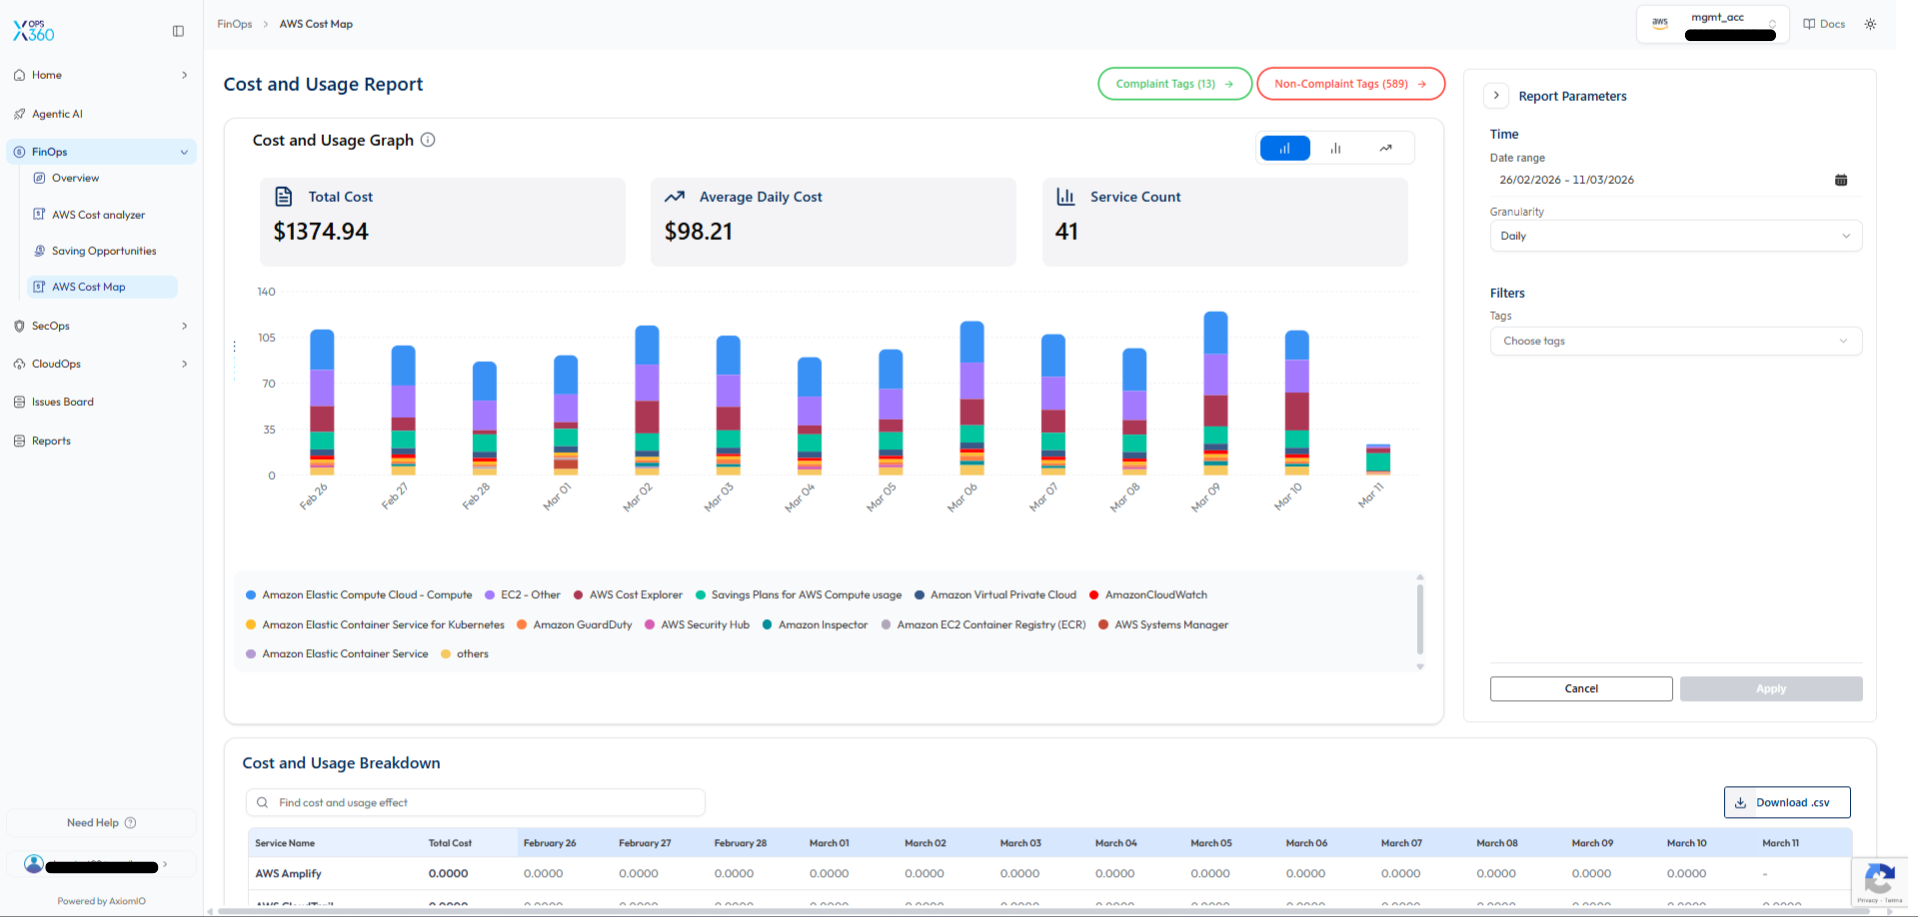
AWS Cost Map
The AWS Cost Map provides a detailed visualization of AWS cost and usage trends.
Key features include:
-
Total Cost – Displays the overall cloud spending within the selected time range.
-
Average Daily Cost – Shows average daily spending trends.
-
Service Count – Displays the number of AWS services contributing to costs.
Additional capabilities include:
-
Cost and Usage Graph – Visualizes daily cost distribution by AWS service.
-
Cost and Usage Breakdown Table – Displays detailed cost data per service.
-
Filtering Options – Allows filtering by date range, granularity, and resource tags.
-
CSV Export – Enables downloading cost data for external analysis and reporting.
🔹 Why it’s better:
Unlike traditional billing dashboards that show only aggregated monthly costs, the Cost Map provides granular daily insights, helping teams detect cost spikes early and maintain better cost control.